Linear mixed effects model
Linear mixed effects models are commonly used for regression analyses involving repeated measurements made on each subject (i.e dependent data). It is possible to perform such an analysis using imputation data (dosage format), where each imputed genotypes varies between 0 and 2 (inclusively). A value close to 0 means that a homozygous genotype of the most frequent allele is the most probable. A value close to 2 means that a homozygous genotype of the rare allele is the most probable. Finally, a value close to 1 means that a heterozygous genotype is the most probable.
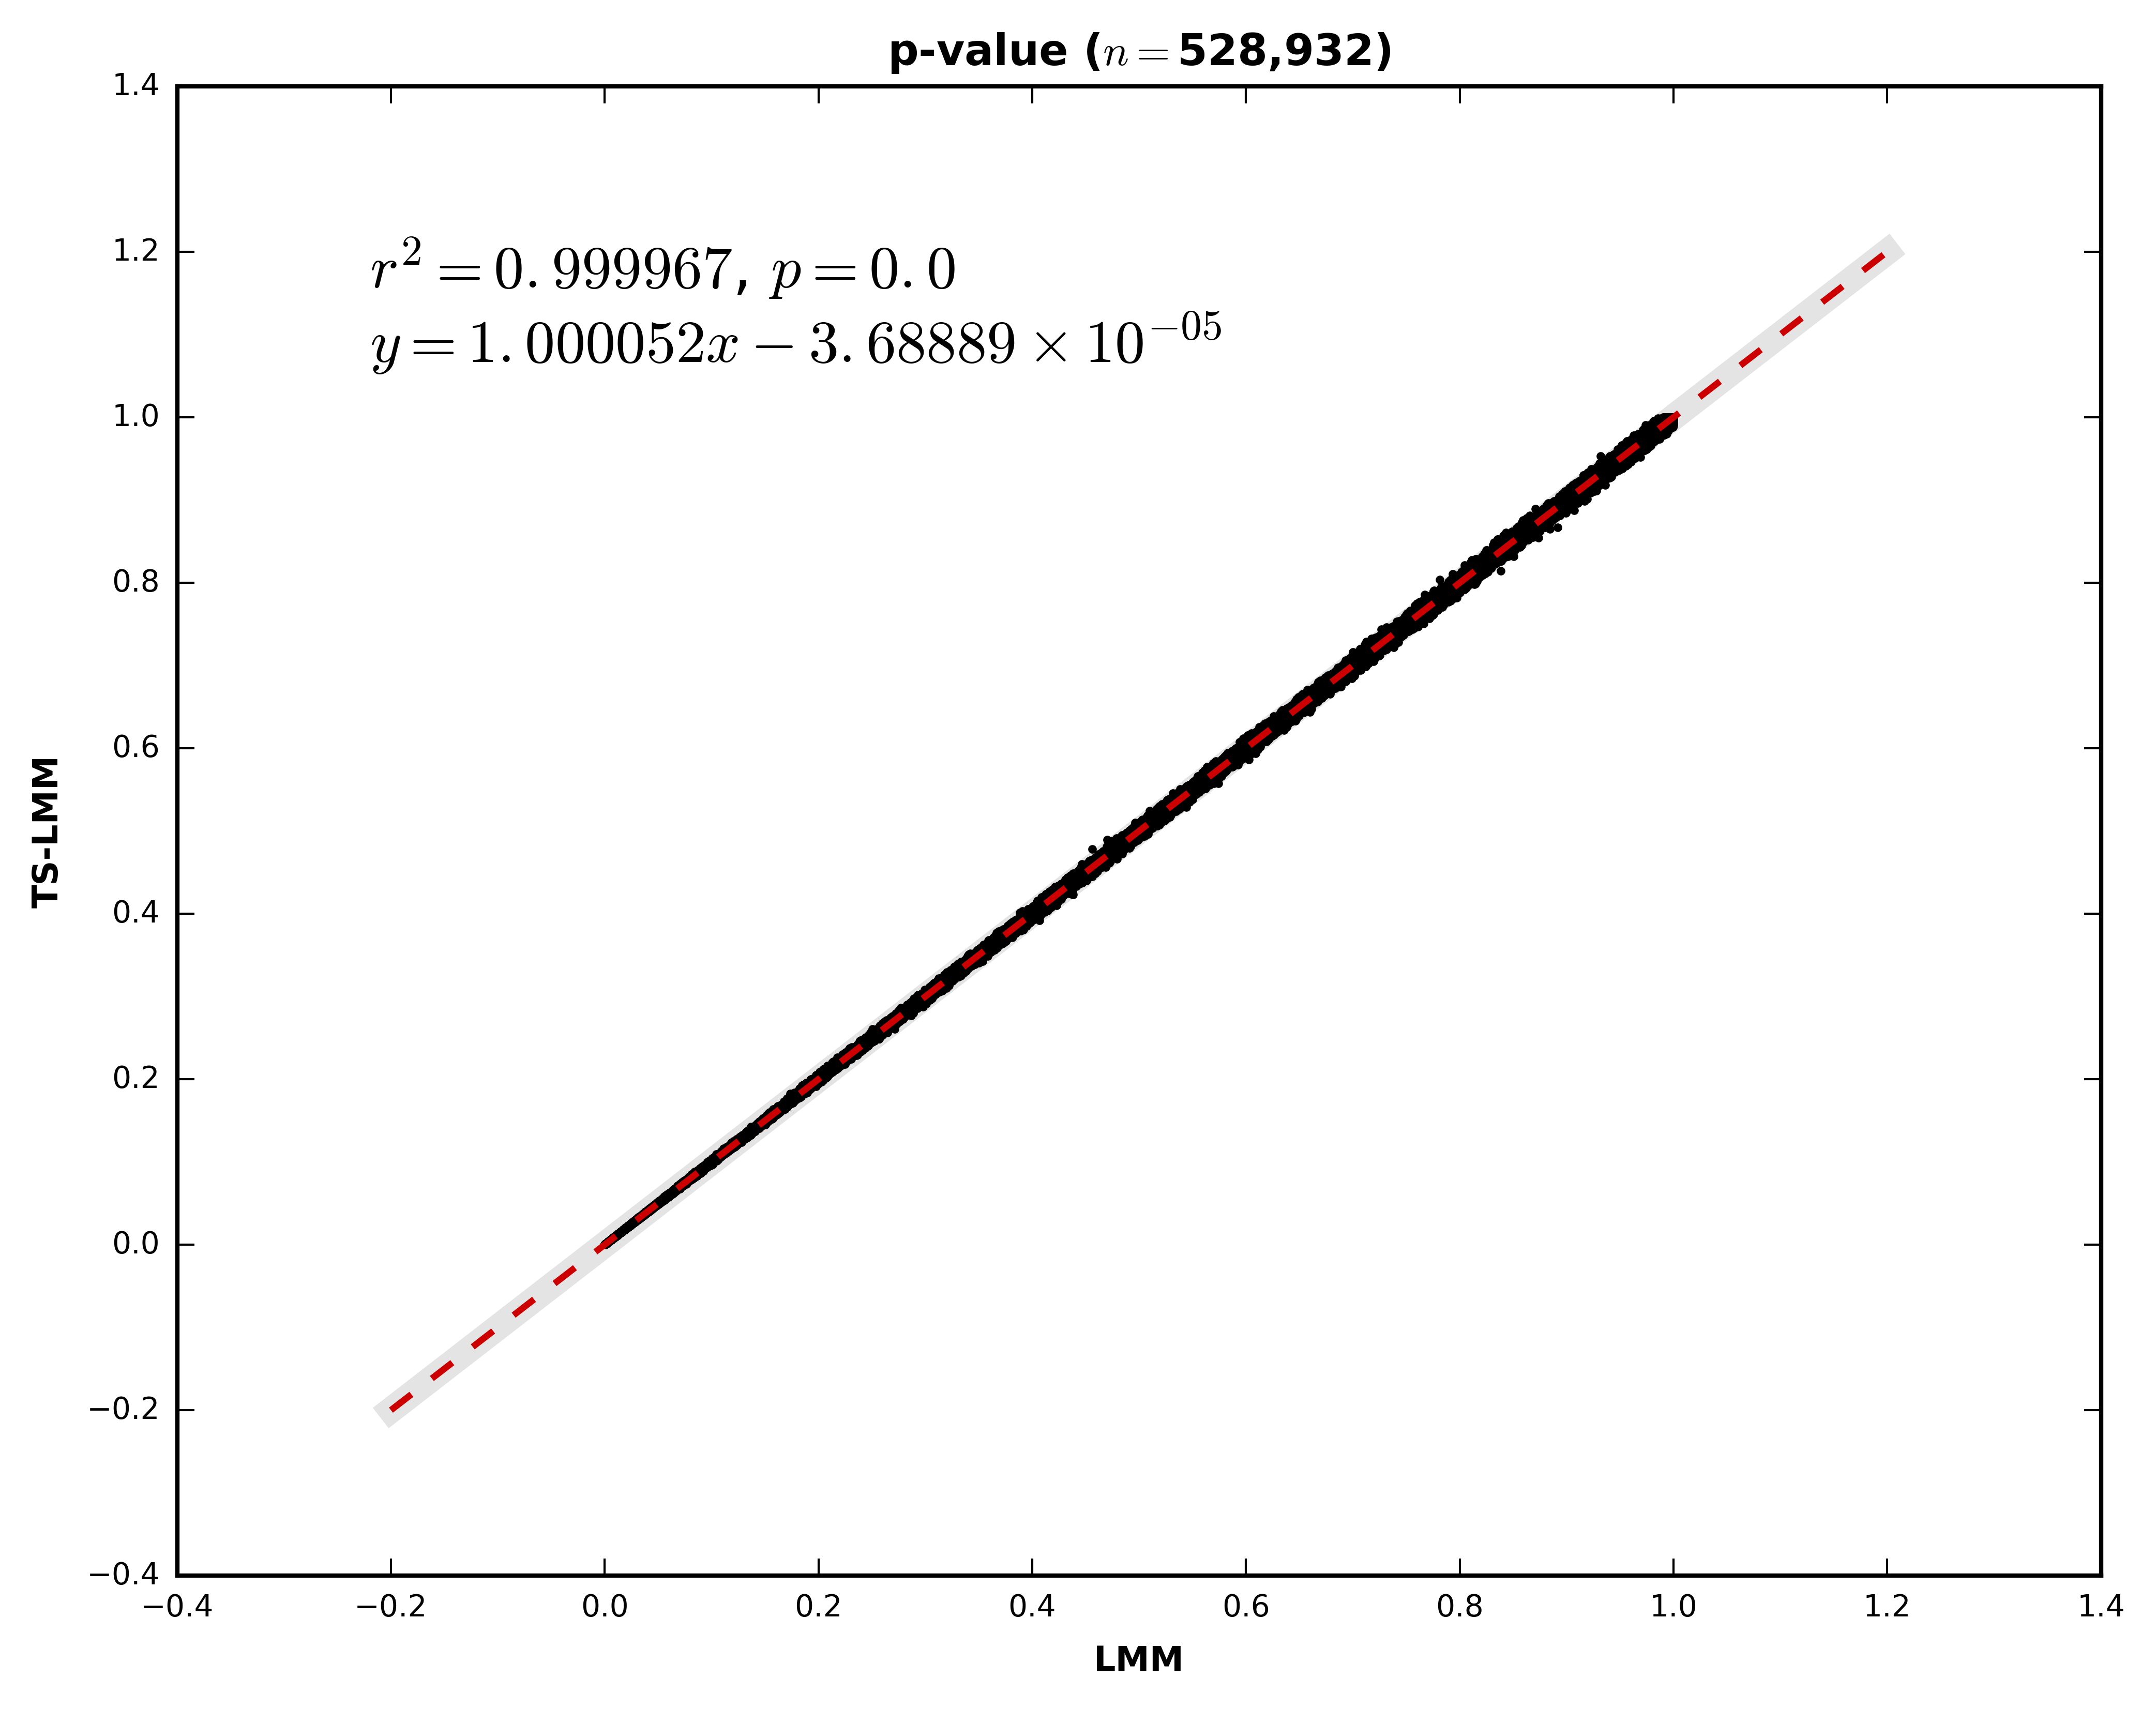
An optimization is made so that the analysis is less time consuming for large scale imputation data. The p-value of the SNP is estimated using the two-step linear mixed model (as describe by Sikorska et al., 2015 [doi: 10.1038/ejhg.2015.1]). If the p-value is lower than a user specified threshold, the exact mixed linear model analysis is performed for this marker to gather all the important statistics (e.g. beta).
The precision of the estimated p-value is quite high, as demonstrated by the following figure. The p-values were compared between the two-step approach (y axis) and the original one (x axis). The analysis was performed on 5,045 samples imputed on chromosome 2 (528,932 high quality imputed markers with MAF higher than 1%).
We suppose that you have followed the main Genome-wide imputation pipeline. The following command will create the working directory for this tutorial.
mkdir -p $HOME/genipe_tutorial/mixedlm
Input files
Imputed genotypes
After running the genipe pipeline, the imputed genotypes files will
have the .impute2 or .impute2.gz extension Those files will be located
in the final_impute2 directories of each chromosomes. There should be one
impute2 file per chromosome (see the
genipe/chrN/final_impute2 directories section in the main
Genome-wide imputation pipeline). These files consist of the imputed genotypes required
to perform the analysis.
The general structure of the file contains the following columns (which are space delimited): the chromosome, the name of the marker, its position and its two alleles. The subsequent columns correspond to the probabilities of each genotype (hence, there are three columns per sample). The first value correspond to the probability of being homozygous of the first allele. The second value correspond to the probability of being heterozygous. Finally, the third value correspond to the probability of being homozygous of the second allele. The following example shows two lines of the impute2 file.
21 rs376366718:10000302:A:G 10000302 A G 0.986 0.014 0 1 0 0 1 0 0 ...
21 21:10002805:C:T 10002805 C T 0.254 0.736 0.010 0.810 0.188 0.002 0.800 0.195 0.005 ...
Samples file
This file is generated by genipe and has the .sample extension.
There should be one sample file per chromosome (see the
genipe/chrN/final_impute2 directories section in the main
Genome-wide imputation pipeline). These files greatly resembles the Plink fam
file. Specifically, it contains the samples that are included in the impute2
file (with the same order). It is needed to correctly interpret the sample
described by the impute2 file. The format is as follow:
ID_1 ID_2 missing father mother sex plink_pheno
0 0 0 D D D B
1341 NA06985 0 0 0 2 -9
1341 NA06991 0 NA06993 NA06985 2 -9
1341 NA06993 0 0 0 1 -9
...
The first two rows are part of the format and should be as is.
Warning
The column ID_2 should contain unique sample identification numbers,
since the analysis will only consider the ID_2 (which correspond to the
sample ID in the Plink file) to correctly match the samples and the
imputed genotypes.
Phenotype file
This file describes the phenotype and variables used to perform the analysis. The file is tab separated and contains one row per sample, one column per phenotype/variable.
The following is an example of a phenotype file (where there are three measurements per sample):
SampleID        Pheno3  Visit   Age     Var1    Gender
NA06985 58.6923101992   1       53      48.01043142060001       2
NA06985 79.18026839086532       2       53      48.01043142060001       2
NA06985 97.6831921953767        3       53      48.01043142060001       2
NA06993 64.8981628053   1       47      23.7615117523   1
NA06993 81.26389783395985       2       47      23.7615117523   1
NA06993 100.71531297841551      3       47      23.7615117523   1
NA06994 129.562482664   1       48      20.2946857226   1
NA06994 144.2513248255908       2       48      20.2946857226   1
NA06994 161.94488318622538      3       48      20.2946857226   1
...
We provide a dummy phenotype file (where values, except for Gender, were
randomly generated for 60 founders of the dataset). The following command
should download the phenotype file.
cd $HOME/genipe_tutorial/mixedlm

wget http://pgxcentre.github.io/genipe/_static/tutorial/phenotypes_mixedlm.txt.bz2
bunzip2 phenotypes_mixedlm.txt.bz2
Note
Note that the gender is encoded such that males are 1 and females are
2. Samples with missing gender (encoded as 0) will be excluded only
if gender is in the covariable list.
Note
Categorical variables should be specified using the --categorical
option.
Warning
The sample identification numbers should match the ones in the sample file (see above). Those numbers should be unique for each sample. There should be multiple rows for each sample, one for each repeated measurement. Only the samples that are both in the sample and phenotype files will be kept for analysis. The order of the samples in the phenotype file is not important.
Sites to extract (optional)
This file (which is optional) should contain a list of site (one identification
number per line) to keep for the analysis. This file might be the
.good_sites file automatically generated by genipe (see the
genipe/chrN/final_impute2 directories section in the main
Genome-wide imputation pipeline).
Executing the analysis
If you followed the Genome-wide imputation pipeline, the following commands should execute the linear mixed effects analysis.
cd $HOME/genipe_tutorial/mixedlm

imputed-stats mixedlm \
    --impute2 ../genipe/chr22/final_impute2/chr22.imputed.impute2.gz \
    --sample ../genipe/chr22/final_impute2/chr22.imputed.sample \
    --pheno phenotypes_mixedlm.txt \
    --extract-sites ../genipe/chr22/final_impute2/chr22.imputed.good_sites \
    --nb-process 8 \
    --nb-lines 6000 \
    --gender-column Gender \
    --covar Age,Var1,Gender \
    --sample-column SampleID \
    --pheno-name Pheno3
For more information about the arguments and options, see the Usage section. For an approximation of the execution time, refer to the Statistical Analysis Execution Time section.
Note
Analysis will be performed only on samples whitout missing data (phenotype, gender, variables, etc).
By default, the analysis is performed by removing low quality genotypes
(using a probability threshold of 0.9, the --prob option).
Output files
There will be two output files: .mixedlm.dosage will contain the
statistics, and .log will contain the execution log.
.mixedlm.dosage file
This file contains the results from the linear mixed effects analysis. It shows the following information:
chr: the chromosome.pos: the position on the chromosome.snp: the name of the marker.major: the major allele.minor: the minor allele.maf: the frequency of the minor allele.n: the number of samples that were used for this marker.coef: the coefficient.se: the standard error.lower: the lower value of the 95% confidence interval.upper: the upper value of the 95% confidence interval.z: the z-statistic.p: the p-value.
Note
By default, the statistics are computed only for markers with a minor allele
frequency of 1% and higher. Markers with lower MAF will have NA values.
To modify this behavior, use the --maf option.
Usage
The following command will display the documentation for the linear mixed effects analysis in the console:
$ imputed-stats mixedlm --help
usage: imputed-stats mixedlm [-h] [-v] [--debug] --impute2 FILE --sample FILE
                             --pheno FILE [--extract-sites FILE] [--out FILE]
                             [--nb-process INT] [--nb-lines INT] [--chrx]
                             [--gender-column NAME] [--scale INT]
                             [--prob FLOAT] [--maf FLOAT] [--covar NAME]
                             [--categorical NAME] [--missing-value NAME]
                             [--sample-column NAME] [--interaction NAME]
                             --pheno-name NAME [--use-ml]
                             [--p-threshold FLOAT]

Performs a linear mixed effects regression on imputed data using a random
intercept for each group. A p-value approximation is performed so that
computation time is acceptable for imputed data. This script is part of the
'genipe' package, version 1.4.2.

optional arguments:
  -h, --help            show this help message and exit
  -v, --version         show program's version number and exit
  --debug               set the logging level to debug

Input Files:
  --impute2 FILE        The output from IMPUTE2.
  --sample FILE         The sample file (the order should be the same as in
                        the IMPUTE2 files).
  --pheno FILE          The file containing phenotypes and co variables.
  --extract-sites FILE  A list of sites to extract for analysis (optional).

Output Options:
  --out FILE            The prefix for the output files. [imputed_stats]

General Options:
  --nb-process INT      The number of process to use. [1]
  --nb-lines INT        The number of line to read at a time. [1000]
  --chrx                The analysis is performed for the non pseudo-autosomal
                        region of the chromosome X (male dosage will be
                        divided by 2 to get values [0, 0.5] instead of [0, 1])
                        (males are coded as 1 and option '--gender-column'
                        should be used).
  --gender-column NAME  The name of the gender column (use to exclude samples
                        with unknown gender (i.e. not 1, male, or 2, female).
                        If gender not available, use 'None'. [Gender]

Dosage Options:
  --scale INT           Scale dosage so that values are in [0, n] (possible
                        values are 1 (no scaling) or 2). [2]
  --prob FLOAT          The minimal probability for which a genotype should be
                        considered. [>=0.9]
  --maf FLOAT           Minor allele frequency threshold for which marker will
                        be skipped. [<0.01]

Phenotype Options:
  --covar NAME          The co variable names (in the phenotype file),
                        separated by coma.
  --categorical NAME    The name of the variables that are categorical (note
                        that the gender is always categorical). The variables
                        are separated by coma.
  --missing-value NAME  The missing value in the phenotype file.
  --sample-column NAME  The name of the sample ID column (in the phenotype
                        file). [sample_id]
  --interaction NAME    Add an interaction between the genotype and this
                        variable.

Linear Mixed Effects Options:
  --pheno-name NAME     The phenotype.
  --use-ml              Fit the standard likelihood using maximum likelihood
                        (ML) estimation instead of REML (default is REML).
  --p-threshold FLOAT   The p-value threshold for which the real MixedLM
                        analysis will be performed. [<0.0001]
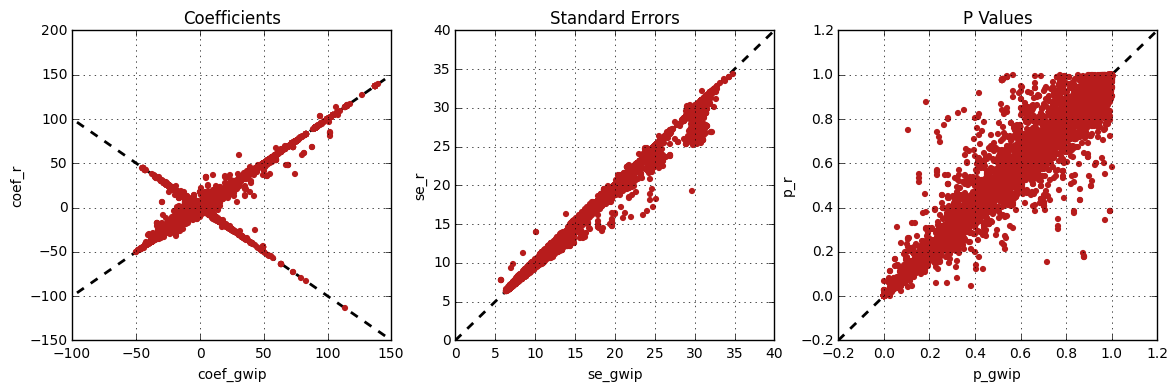
Results comparison
The linear mixed effects analysis results from genipe and R were
compared for validity. The following figure shows the comparison for, from left
to right, the coefficients, the standard errors and the p-values. The x
axis shows the results from genipe, and the y axis shows the
results for R. This comparison includes 163,670 “good” imputed markers,
analyzed for 60 samples (i.e results from this tutorial). Note that for this
comparison, the probability threshold (--prob) was changed from 0.9
to 0 to imitate R analysis (see note below for more information).
Note
The sign of the coefficients might be different when comparing
genipe to R, since genipe computes the statistics on
the rare allele, while R computes them on the second (alternative) allele.
The alternative allele might not always be the rarest.
Note
By default, genipe excludes samples with a maximum probability
lower than 0.9 (the --prob option), while R keeps all the samples for
the analysis. In order to get the same results as R, the analysis must be
done with a probability threshold of 0 (i.e. --prob 0, keeping all
imputed genotypes including those with poor quality). This is what was done
for the previous figure.
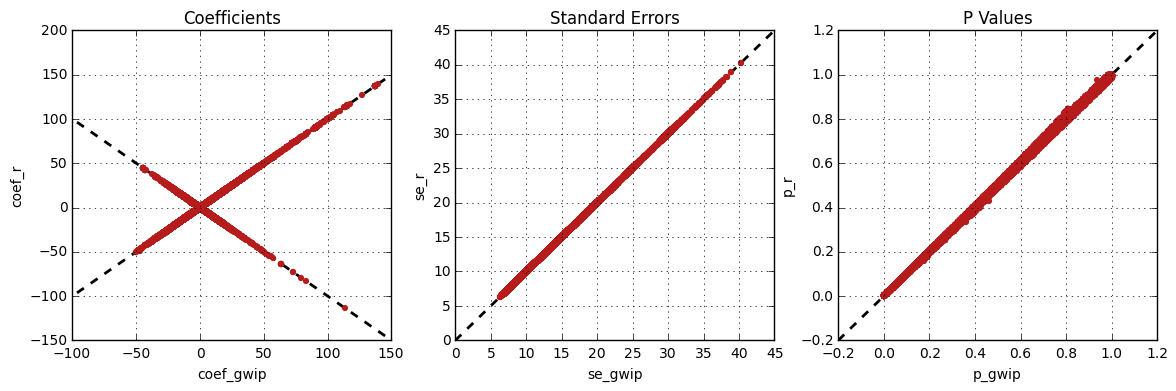
The following figure shows the comparison between R and genipe
for the same analysis, but using the default probability threshold of 0.9
(excluding imputed genotypes with poor quality). Hence, 163,670 markers
were compared.